
To understand esports stats, connect every number to the game’s win condition first. Kills matter in one shooter, gold and map control in a MOBA, territory and time in a strategy game. A number is only useful once you know what it did to the objective.
That is the whole trick, and it is smaller than the broadcast makes it look. The overlay in the corner of the screen is not a report card handed to you at the end. It is a running commentary of a fight the teams are having over one specific thing, and the stats are just the receipts.
If you have ever muted a caster because the words made no sense, you are in the right place. Below is the plain version: what the numbers mean, when they lie, and what to watch on screen instead of them.
Table of Contents
- How to Understand Esports Stats as a New Viewer
- Start with the Game’s Win Condition
- What Do the Most Common Esports Stats Mean?
- How to Understand Esports Stats in One Match
- How Do You Read a Team’s Numbers Without Jumping to Conclusions?
- When Do Esports Stats Become Misleading?
- What Should You Watch Alongside the Stats?
- Frequently Asked Questions
- What does KDA mean in esports?
- Is a higher KDA always better in esports?
- How can I compare two esports teams fairly?
- Why does an esports player’s win rate need context?
- Which esports stats should a new viewer watch first?
- Conclusion: What to Watch First
How to Understand Esports Stats as a New Viewer
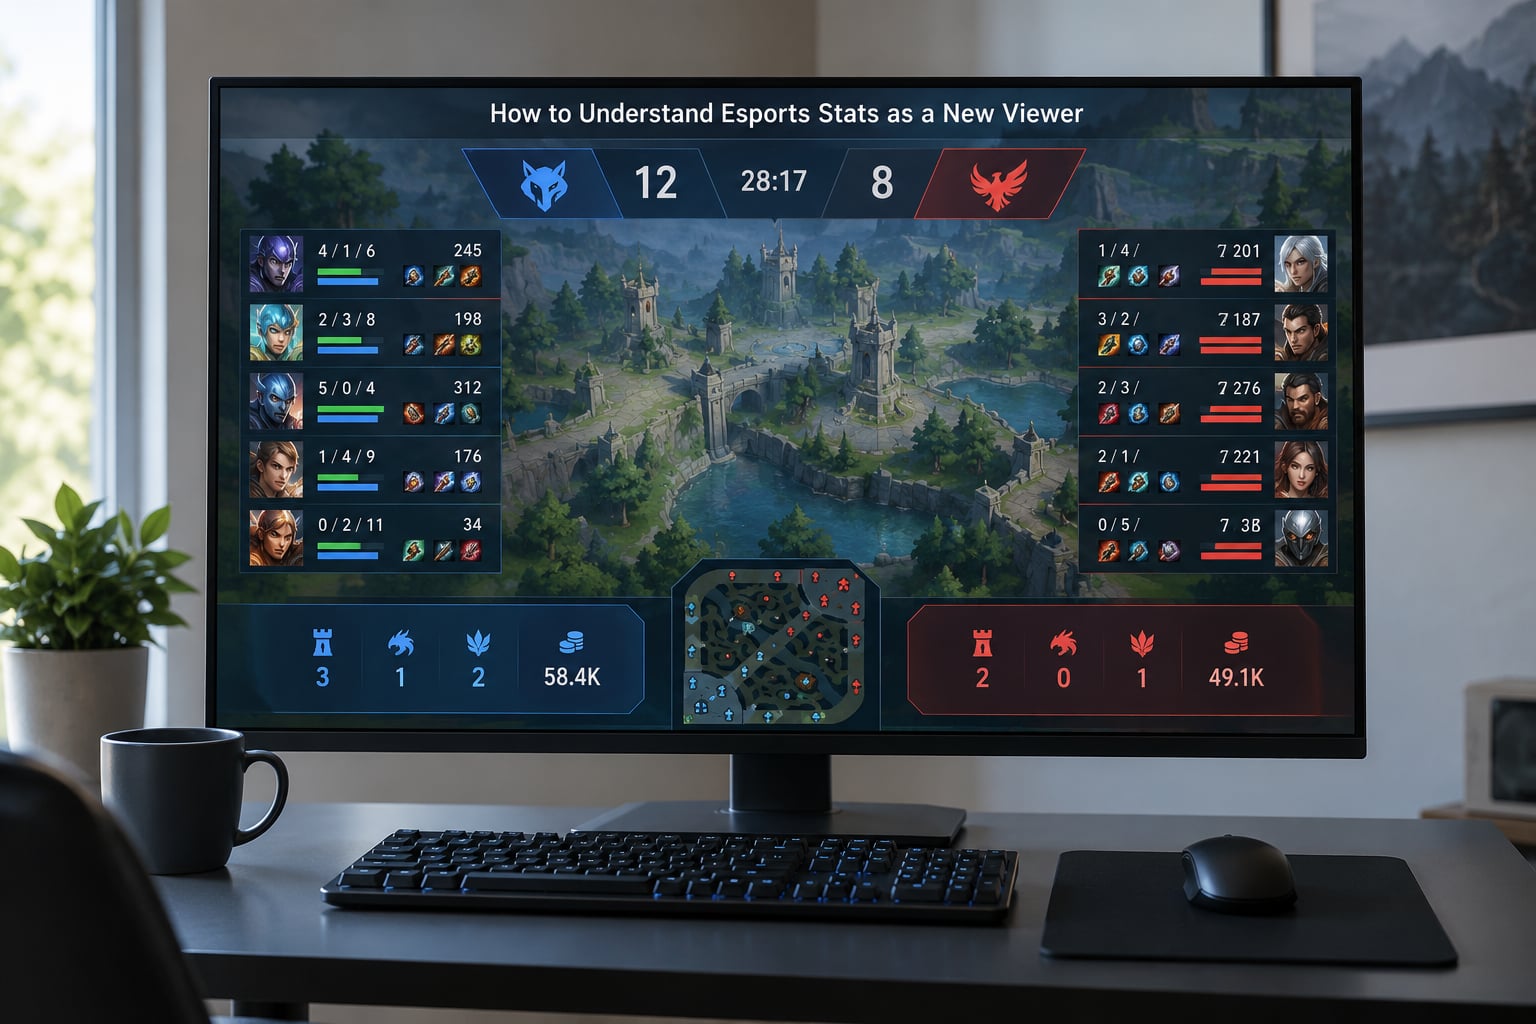
Esports stats are recorded performance numbers for players and teams: kills, deaths, assists, damage dealt, gold earned, objectives taken, win rate and ratings. Together they describe how a side performed, but on their own they explain nothing.
Every time you look at a stat line, ask three questions in order. What happened? Why did it happen? Did it change the objective the teams were fighting over? A stat that answers the first question and skips the third is decoration.
That third question is what turns a spectator into someone who can follow a match. Teams in esports do not usually win by out-killing each other. They win by taking an objective, holding ground, or surviving longer than the other side, and the kills are usually a side effect of that goal rather than the goal itself.
Start with the scoreboard, find the objective, then let the stats explain how the gap opened. Everything else is detail.
Start with the Game’s Win Condition
No stat is universally important. The same number can be decisive in one title and irrelevant in the next, so any list that starts with “the most important stat” without naming the game is giving you a habit, not a tool.
Before you look at any stat, work out how the match is actually decided in that title. Then give your attention to the numbers that feed directly into that decision.
| Game type | How the match is won | Stats to watch first | Stat to ignore early on |
|---|---|---|---|
| Tactical shooter (CS2, Valorant) | Win more rounds, usually by taking and holding sites | ADR, opening kill rate, round economy, clutches | Raw total kills across the map |
| MOBA (League of Legends, Dota 2) | Destroy the enemy base, often gated on objectives first | Gold and experience per minute, tower and objective control, creep score | KDA |
| Battle royale | Be last team standing | Placement, damage to survivors, zone timing, team wipe counts | Solo kills |
| Strategy or real-time strategy | Outlast, outproduce or out-position the opponent | Resources, supply and economy, upgrade timings, map control | Unit kill counts |
| Fighting game | Win more rounds of a set | Round wins, damage per round, neutral round win rate | Combo length |
| Sports or racing sim | Finish ahead on track or on the scoreboard | Pace, position, lap time, race control, tyre and fuel management | Top-speed number |
Notice how rarely raw kills appear as a top priority. In every one of these rows, kills sit downstream of something the team was actually trying to do.
What Do the Most Common Esports Stats Mean?
Here is the reference block I keep open during a match. Each entry says what the stat measures, why anyone cares, and the mistake that trips up new viewers most often.
| Stat | What it measures | Why it matters | Common misread |
|---|---|---|---|
| K/D (kill-death) | Kills divided by deaths | Survival and trade efficiency in a shooter | Treating a high ratio as proof a player is best |
| KDA | (Kills + assists) divided by deaths | Contribution to kills without needing the final shot | Assuming assists are half a kill. They are not |
| ADR | Average damage per round, total damage divided by rounds played | Consistent output in a CS-style round-based shooter | Reading it as impact. Damage into a wall is still damage |
| HS% | Percentage of kills that were headshots | Aim precision, and how much of a player’s game is aim | Assuming a low figure means a bad player |
| GPM and XPM | Gold and experience earned per minute | How efficiently a farm is being farmed, or fed | Ignoring that a support’s gold comes from a different source |
| CS (creep score) | Minions killed, converted into gold | Farm share of a team’s income | Counting it without checking the map time |
| Net worth | Total value of items and resources a player holds | Who can afford to fight and who cannot | Assuming equal net worth means equal strength of item |
| Objective control | How often a side held towers, pits, sites or zones | It maps almost directly to the win condition | Counting a capture that led nowhere |
| Win rate | Wins divided by games or maps played | Results, the only stat that never lies about outcomes | Reading it without opponent or sample size |
| Rating | A weighted composite, for example HLTV Rating 2.0 or a rating scale per title | Compresses a whole map into one comparable line | Comparing ratings across different games |
| Clutch rate | Wins in situations where the player was last alive or outnumbered | Pressure performance when the game is unwinnable for teammates | Counting low-pressure 1vX as clutch situations |
Here is how the arithmetic works, so nothing on that panel stays a mystery. A player finishes a CS map with 18 kills and 12 deaths: 18 divided by 12 gives a K/D of 1.50. Add 6 assists and the KDA becomes 24 divided by 12, or 2.00. Same fights, different question answered.
For ADR, take 3,000 total damage across 22 rounds and you get roughly 136 damage per round. For GPM, a jungler with 480 gold at the 30 minute mark is earning 16 gold per minute, which tells you their farming speed without telling you whether they used it well.
That last gap is the important one. Numbers describe output. They do not describe decisions, and in a close match the decisions are what win it.
How to Understand Esports Stats in One Match
Here is the routine I use live, roughly in this order, and it takes under a minute per game or round.
- Lock the score and the clock. Before reading anything else, know which game or map it is, who is up, and how much time is left. Every other number means something different depending on this.
- Name the objective. In a MOBA it is usually the enemy base, with towers and objectives in front of it. In a shooter it is the site. Write it down mentally so you have something to measure against.
- Spot the momentum shift. Most matches turn on a short window: a won fight that swings gold, a plant that swings the economy. Note when it happened.
- Compare team totals, not player totals. Two players on one team will never be equal, so team-level numbers are the fairer comparison.
- Check the individual leader in the stat that matches the objective. If it is an economy round, look at money, not kills.
- Watch for the translation. Ask whether the numbers actually turned into map or game control. A team leading on a stat and losing the objective is telling you something real.
That last check is the one that separates a viewer who follows the numbers from a viewer who follows the game. A team can lead on damage and still lose every fight that matters, because they were shooting in the wrong place.
How Do You Read a Team’s Numbers Without Jumping to Conclusions?
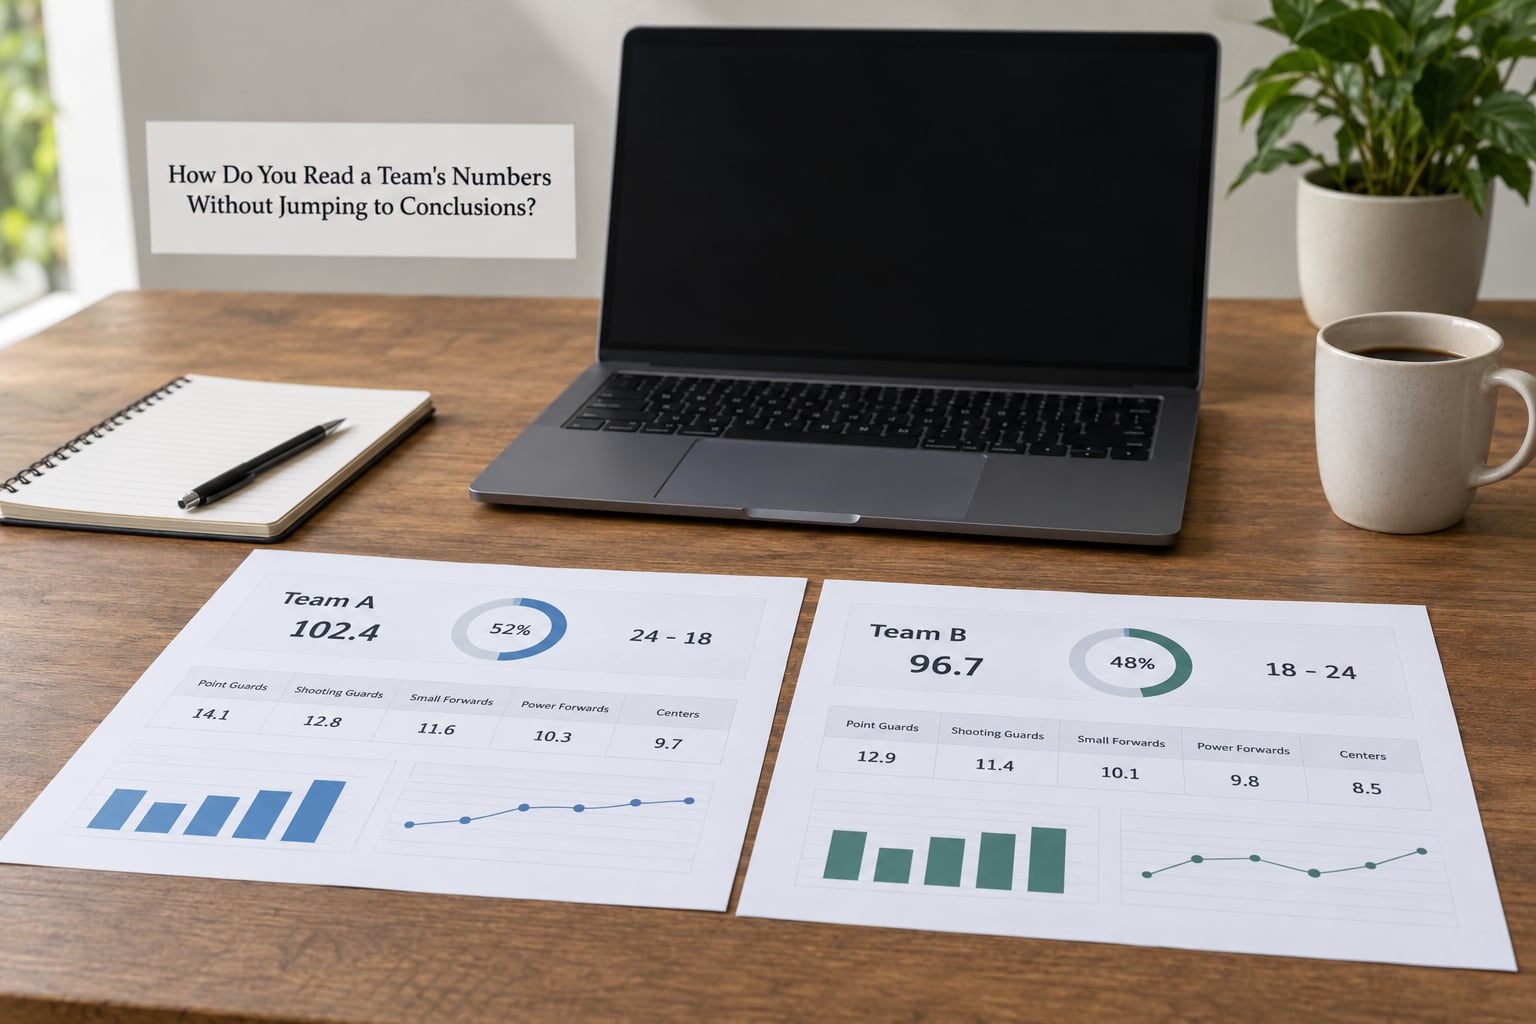
Most bad stat arguments come from mixing formats. A total, an average, a ratio and a percentage all look like numbers and answer completely different questions.
| Format | What it reveals | What it hides |
|---|---|---|
| Total (340 damage in a match) | Volume of activity | Map length and teammates’ behaviour |
| Average (136 ADR) | Rate, so matches of different length can be compared | Whether the output was concentrated in one round |
| Ratio (1.50 K/D) | Balance between two behaviours | Volume, context and role |
| Percentage (62% headshots) | Share of something, independent of sample size | How many opportunities there were |
| Streak (9-round win streak) | Momentum and adaptation | Whether it started from behind or ahead |
| Single map split | How a side plays when a map is forced on them | Comfort, and how often they get to pick |
| Career total | Longevity and consistency | Patch changes, roles and team eras |
Two more filters sit above all of these. Ask who the opponent was, because 18 kills against a bottom-of-the-table side means less than 18 against the number one team. And ask when the sample was recorded, because patches change item values, character power and even which map is being played.
Role matters just as much. A support or an in-game leader will often finish with a modest KDA because the job was to place a ward, hold a position or trigger a call, and none of that produces a highlight. Comparing that player to a carry on the same team is comparing two different job descriptions.
Forum threads on r/R6ProLeague keep a running warning about exactly this, and the pushback is fair. Players who do entry work describe their stats as a poor reflection of what they did, because the stat sheet has no column for “made four teammates able to do their job”.
When Do Esports Stats Become Misleading?
Some traps are statistical, and some are human. The human ones cause more damage.
Cherry-picked highlights. A 20 kill clip tells you one round happened. It does not tell you what the scoreboard looked like, whether the round was still winnable, or what happened in the nine rounds before it. Viewers routinely use stats to confirm a take they already had, which is the fastest way to learn something false. Inflated KDA. KDA rewards not dying, which is not always a choice. A player who takes fights they should not take and pays for it gets a better ratio than a teammate who holds a crossfire for four rounds and keeps the round winnable. Streaks in tiny samples. A five-map sample says almost nothing. This one is worth internalising because pro schedules are short: five maps in a tournament is a weekend, not a season. Comparing across roles or patches. A rating produced under last year’s balance is not this year’s rating. A jungler’s CS is not a laner’s CS. Treating correlation as cause. Teams that win first objectives also win games. That does not mean the first objective is the cause; it may be a symptom of a stronger economy that made the objective easy. Counting utility per round. In tactical shooters, utility damage and flash assists get tallied per round rather than by what they enabled. A player can have a modest utility number and set up the round that wins the match. Game-length inflation. In a long map, totals rise for everyone. Per-round and per-minute figures exist precisely to correct for this, which is why raw totals are the least useful number on the panel.A commentator I have watched for years put it bluntly: most people describing themselves as stats experts start with a conclusion and bend numbers until they fit. That is a fair charge, and the fix is simple. Look at the screen before you look at the sheet.
What Should You Watch Alongside the Stats?
Numbers tell you what happened. They rarely tell you why, because the game only records the parts that can be counted. What happened between the numbers is the actual content of the broadcast.
Positioning comes first. Two players can trade identical damage and have completely different value, because one took an angle the other could not have used. A lurk that pulls a rotation buys the rest of the team a free window, and that player might finish with three damage.
Resource tradeoffs explain a lot of what looks like passive play. A side saving money for the next round will lose the current one on purpose. That loss shows on the stat line as a bad round, and on screen it is a decision.
Team coordination is where viewers get the most value and least practice. Watch how a team sets up an objective: how much space they give up to get there, who holds what while the spike plants or the monsters spawn, and what happens when the setup fails halfway through.
Here is the example I come back to. A trailing team down nine rounds loses a pistol round and the scoreboard gets worse. But they bought nothing, so they now have money for the next round while the leading team has nothing left. The stat line says they are getting crushed. The next two rounds say the opposite, because the team that looked weaker bought a win.
For your first few matches, run five checks before you form an opinion. Find the scoreboard and the clock. Name the objective. Watch for the momentum shift. Check the one individual stat that matches the objective. Then watch the setup that produced it. If the numbers and the screen disagree, trust the screen, because that is where the team had to live.
Two habits will speed this up. Follow one stat site per title rather than five, so you learn a single layout, and look at map splits instead of career pages for the first month. Career numbers reward familiarity with a stat sheet, and you want the simpler version first.
Stat sources worth learning: HLTV for Counter-Strike, vLR for a cross-game comparison, gol.gg and Leaguepedia for League of Legends, and Oracle’s Elixir as a free export for deeper numbers. Fans build their own overlay layouts to follow along, which tells you the demand for this is real.
Frequently Asked Questions
What does KDA mean in esports?
KDA is kills, deaths and assists. The KDA ratio adds assists to kills and divides by deaths, so a player with 18 kills, 12 deaths and 6 assists has a KDA of 2.00. It is used in games with an assist mechanic, mainly MOBAs, and in shooters it is usually shortened to K/D. It rewards not dying and helping teammates, which makes it useful but far from complete.
Is a higher KDA always better in esports?
No. KDA measures kills against deaths, and it cannot see positioning, timing or setup. A support, an in-game leader or an entry player often posts a lower ratio while doing the work that wins rounds. In tactical shooters, damage per round and opening kills usually separate players better than K/D does. Treat KDA as one line in a panel, not as a ranking.
How can I compare two esports teams fairly?
Compare them on the same patch, over a similar number of maps, and against similar opponents. Look at map splits and pick or ban win rates before overall records, since a team may never have been given its best map. Then check whether their wins come from strong fundamentals, like gold lead or round economy, or from one standout map. Overall win rate tells you the outcome, not the reason.
Why does an esports player’s win rate need context?
Win rate counts results, not causes. A player on a strong team inherits wins they did not earn, and one on a rebuilding roster can post a low rate while improving every week. Sample size matters too, because five maps is a weekend rather than a season. Read win rate alongside map splits, opponent strength and the team’s actual objective control before drawing conclusions.
Which esports stats should a new viewer watch first?
Start with the score and the game clock, because they frame everything else. Then find the stat tied to that game’s win condition: damage per round and round economy in tactical shooters, gold and experience per minute in MOBAs, placement in battle royales. Add team-level numbers before individual ones, and check one relevant individual stat to find out who is driving the game.
Conclusion: What to Watch First
If you take one thing from this, make it the win condition. Every other decision follows from it: which stat matters, what a good number looks like, and whether a great stat line actually moved the game anywhere.
Your first pass through a match takes five steps. Read the score and the clock. Name the objective the teams are fighting over. Watch for the moment it turned. Use team totals to find the story, then check the one individual stat tied to that objective. Finally, watch the setup on screen that produced it, and believe the screen over the sheet when they disagree.
Get comfortable with two or three stats in your title rather than all twelve. Pick one stat site, stay with it for a month, and let the casters fill in the rest. Esports stats are simple once you know what question each one is answering, and after a handful of matches the overlay stops being noise.