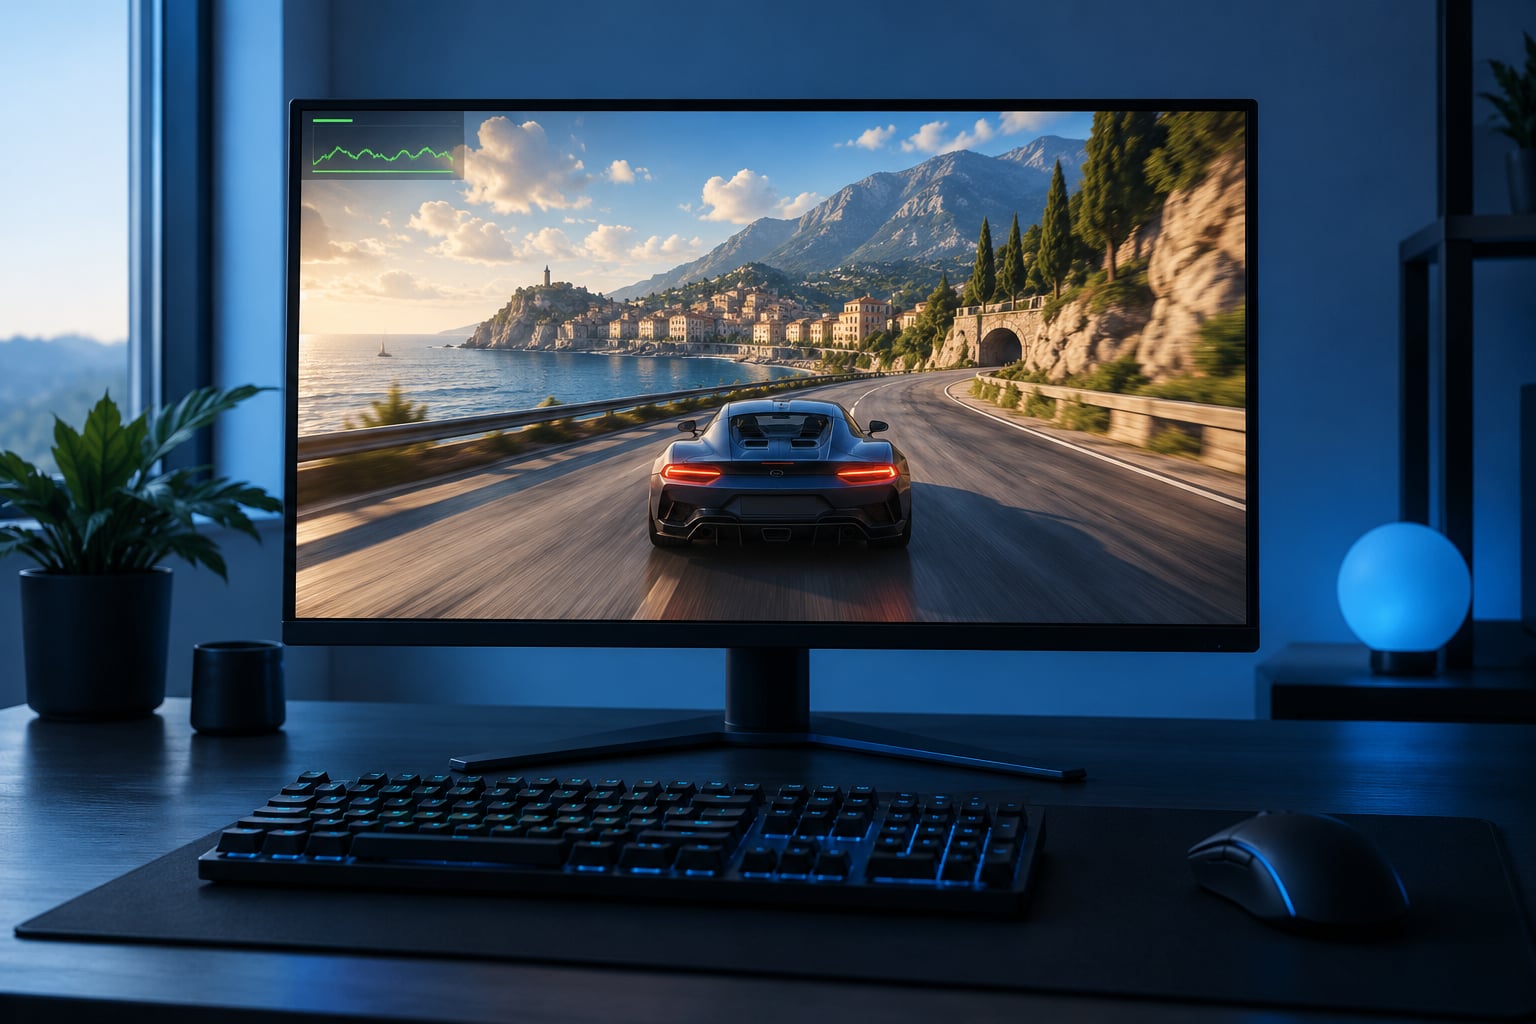
To monitor FPS and frame time while gaming on PC, press Win+G to open the Xbox Game Bar, open the Performance widget and set the FPS graph to visible — that takes about ten seconds and installs nothing. For frame time, 1% lows and CPU/GPU load, add MSI Afterburner with RivaTuner Statistics Server (RTSS), which is the overlay most players actually use.
FPS alone will let you down. A counter can sit at a comfortable 90 while the game still stutters every few seconds, because a single 40 ms frame inside an average of 90 tells you almost nothing about how the game feels. Frame time is what exposes that.
Table of Contents
- What You Need
- How to Monitor FPS and Frame Time While Gaming
- What frame time actually means
- Step-by-Step
- Step 1: Check the FPS and frame-time display built into your game
- Step 2: Enable your graphics card overlay
- Step 3: Add a dedicated monitoring tool when you need more detail
- Step 4: Test a repeatable gameplay scene
- Step 5: Use the results to fix stutter or low FPS
- Common Mistakes
- Frequently Asked Questions
- Where can I monitor FPS and frame time while gaming?
- Is 60 FPS enough for most PC games?
- What is the difference between FPS and frame time?
- Why does my game stutter even when the average FPS is high?
- Should I monitor performance in a benchmark or during normal gameplay?
- How do I check FPS on a PlayStation or Xbox?
- Conclusion
What You Need
Very little. A Windows PC, a game that runs on it, and one way to draw numbers on top of the game. That last part can be a counter the game already ships with, a Windows or Steam overlay, or a driver-level tool that works across every title.
A high refresh-rate monitor helps you feel the difference between a good result and a great one, but it is not required for measuring. Plenty of the most useful diagnosis happens on a 60 Hz panel at 30 FPS, because the problems that cause stutter show up just as clearly there.
You do not need a fast CPU, a new GPU, or any paid software. Every tool named in this guide is free, and the one exception is a capture feature inside a tool you have already installed.
How to Monitor FPS and Frame Time While Gaming
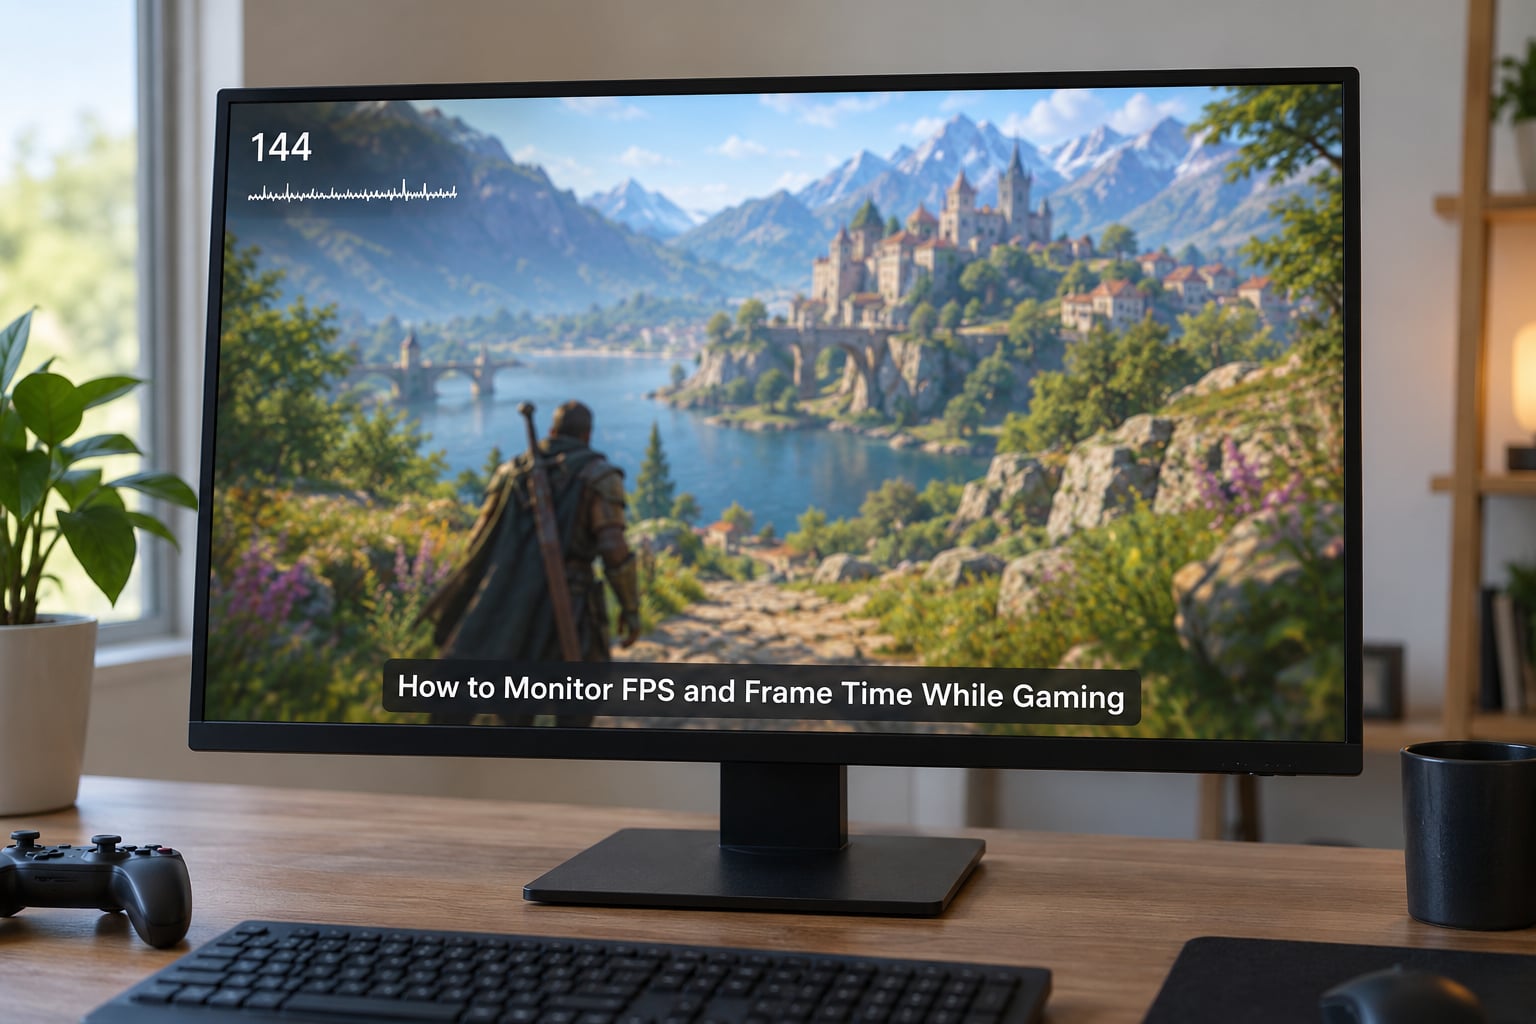
There are three routes, and they differ in how much they tell you. The game’s own counter is quickest but usually limited to a single number. Windows and Steam overlays add a graph. A driver or dedicated overlay adds frame time, temperatures, CPU and GPU usage, and sometimes a limiter, which is where stutter diagnosis actually happens.
Here is the fastest path if you only want a number on screen. Press Win+G, click the Performance widget, and choose the GPU or CPU graph you want. Right-click the widget and set it to show FPS, then click the pin icon so it stays docked. The counter now follows you into full-screen games.
For frame time, the Windows overlay stops short. It shows a rough frame graph but not the millisecond-per-frame reading most people are looking for. That is the job of RTSS, which hooks into DirectX, OpenGL and Vulkan and draws its own readout on top of whatever you are playing.
What frame time actually means
Frame time is how long one frame takes to finish, measured in milliseconds. The two numbers describe the same performance from opposite directions: 60 FPS is roughly 16.7 ms per frame, 30 FPS is roughly 33.3 ms. When the frame rate is steady, the conversion is simple. When it is not, frame time is the more honest number.
Here is the reference table I keep coming back to. If your frame time sits on the line for your refresh rate, your game is doing what you asked of it.
| Refresh rate | Target frame time | Frames per second |
|---|---|---|
| 30 Hz | 33.3 ms | 30 |
| 60 Hz | 16.7 ms | 60 |
| 75 Hz | 13.3 ms | 75 |
| 90 Hz | 11.1 ms | 90 |
| 120 Hz | 8.3 ms | 120 |
| 144 Hz | 6.9 ms | 144 |
| 165 Hz | 6.1 ms | 165 |
| 240 Hz | 4.2 ms | 240 |
| 360 Hz | 2.8 ms | 360 |
Two habits matter more than the rest. Watch the line, not the number, and watch it for a full minute before you decide anything. Players arguing in hardware forum threads about a “drop” are usually looking at a graph that never left the line.
Step-by-Step
Five steps, roughly twenty minutes end to end including install time. Do them in order and stop after each one to confirm the overlay is actually drawing before moving on.
Step 1: Check the FPS and frame-time display built into your game
Open the game’s settings and search for anything called display, performance, statistics or diagnostics. The counter is usually a checkbox in a graphics or video tab, and where it draws on screen is a separate setting, so you may need to set both before it appears.
Check that it is switched on, then look for a frame time option next to it. Some titles show one, some show two lines of text, and plenty show only FPS. If frame time is missing, that is normal and it is the reason most people move to an overlay in Step 2.
How to tell it worked: launch into a normal gameplay scene, not the main menu, and confirm the number changes as you turn. A counter frozen on one value usually means the game is presenting frames at a locked rate or the setting needs the game restarted.
Step 2: Enable your graphics card overlay
Both major vendors ship an overlay, and it is already installed on most machines. On NVIDIA, open the NVIDIA App and turn on the in-game overlay, then hold Alt and press F in a game. On AMD, open Adrenalin, go into Settings, then Gaming, and enable the performance metrics overlay, which toggles with Alt+R.
Keep four figures visible: FPS, GPU usage, GPU temperature and, on AMD, frame time. GPU usage is the one people skip and the one that tells you the most. Sitting at 99% means the graphics card is the limit and you need lower settings or a faster GPU; sitting at 60% while the game struggles means the CPU, memory or drive is the limit and lowering graphics resolution will not help.
On Steam, the built-in overlay is a third option. Press Shift+Tab in-game, click the Performance tab, and you get an FPS graph, frame time, CPU and GPU usage, and VRAM usage with no extra software at all. It is the best zero-install route for Steam players.
If the overlay does not appear in exclusive fullscreen, switch the game to borderless windowed and try again. Some competitive titles block overlays entirely by design.
Step 3: Add a dedicated monitoring tool when you need more detail
This is the step that answers most stutter complaints. Install MSI Afterburner, and during installation tick the box that installs RivaTuner Statistics Server alongside it. RTSS is a separate download that most people miss, and Afterburner without it shows nothing on screen.
Once installed, open the MSI Afterburner icon in the system tray, click the gear icon to open Settings, then choose Monitoring. Tick Framerate and Frame Time, tick Show in On-Screen Display, and leave everything else alone. Start RTSS from the tray so it runs in the background, and both numbers appear in the corner of every game.
From there you can add a frame time graph, GPU and CPU temperature, CPU usage, RAM usage, and the frametime graph that turns diagnosis from guesswork into reading. The 1% low and 0.1% low figures tell you how bad the worst moments were, which is closer to what a player actually remembers than the average.
If you want numbers you can save, compare or share, CapFrameX is the better tool. It logs every frame, shows average, 1% lows and 0.1% lows side by side, and exports a CSV you can open in a spreadsheet or compare against another run.
Step 4: Test a repeatable gameplay scene
Pick one scene you can repeat exactly: the same route, the same combat encounter, the same benchmark run. Test for three to five minutes. Random play generates numbers you cannot compare, because every fight and every corner is different.
Note the average frame time, the worst spikes, GPU usage and CPU usage. Do not screenshot a single dramatic moment, because that is a moment, not a result. Two runs of the same scene that agree with each other are worth more than one clean-looking run.
Compare settings against each other, not against somebody else’s video. A benchmark result means nothing on your machine because your hardware, background applications and power plan are all different.
Step 5: Use the results to fix stutter or low FPS
When GPU usage is high, the fix is graphical. Drop texture quality first, then shadow and ambient occlusion, then resolution. When GPU usage is low and the frame time is still bad, the bottleneck is elsewhere, so look at CPU usage per core, RAM use and whether the game is stuttering on a stutter-heavy drive.
Then check the settings that sit outside the game. Make sure your monitor is running at its native refresh rate in Windows display settings, because a PC left at 60 Hz on a 144 Hz panel wastes the panel. Set your power plan to High Performance or Balanced rather than Power Saver, which throttles the CPU on laptops.
Finally, treat V-Sync and your limiter as one decision rather than two. V-Sync with a stable frame rate is fine; V-Sync without one produces the classic “it feels like 30 while the counter says 60” problem that players describe on the Tom’s Hardware forums. Locking a cap slightly below your refresh rate with RTSS usually smooths that out more reliably than turning V-Sync off.
Common Mistakes
Reading only the average. The average hides the two frames that ruined the session. Add frame time and 1% lows before you draw any conclusion.
Confusing refresh rate with frame rate. 144 Hz is what your display can show; 144 FPS is what your machine produces. They are separate numbers and one does not guarantee the other.
Testing with V-Sync on or off and never the other. Run the same scene both ways. The comparison takes two minutes and explains most inconsistent-feeling games.
Monitoring a menu instead of gameplay. Menus are almost always smooth. Load into the actual scene where you get the stutter, because that is where the graph is useful.
Changing four settings at once. Then you have no idea which one did it. Change one, retest the same scene, and keep a note of what happened.
Trusting an overlay the game is blocking. Anti-cheat and some competitive titles stop overlays from drawing, which leaves a stale frozen number rather than an error. If the number never changes, the overlay is not running.
Forgetting that RTSS is a separate install. This is the single most common Afterburner complaint on the Steam forums. Tick RTSS during setup or nothing appears on screen.
Reading frame time spikes without context. At a 60 FPS budget of 16.7 ms, a spike toward 25 ms is the visible cause of the hitch you felt, per the consensus in TechPowerUp hardware threads. The same 25 ms spike under a 240 FPS cap of 4.2 ms is a catastrophic stall. Always compare against your own cap.
Frequently Asked Questions
Where can I monitor FPS and frame time while gaming?
Windows has a counter built in: press Win+G, open the Performance widget, right-click it and choose the FPS graph, then pin it. For frame time, temperatures and CPU or GPU usage, install MSI Afterburner with RivaTuner Statistics Server and tick Framerate, Frame Time and Show in On-Screen Display in its Monitoring tab. Steam players can also use the Shift+Tab overlay.
Is 60 FPS enough for most PC games?
For single-player games on a 60 Hz monitor, 60 FPS is enough, because the display cannot show more anyway. It stops being enough when two things apply: you own a 120 Hz or faster monitor, or you play competitive shooters where input delay matters as much as image smoothness. On a 144 Hz panel, aim for 144 and expect to drop settings to hold it.
What is the difference between FPS and frame time?
FPS counts how many frames complete in a second, while frame time measures how long one frame takes in milliseconds. They describe the same thing from opposite directions, so 60 FPS is about 16.7 ms per frame. The difference matters when performance is uneven: average FPS can stay high through a stutter, while the frame time graph shows the spike that caused it.
Why does my game stutter even when the average FPS is high?
Because an average hides the bad frames. Sixty frames at 12 ms plus one frame at 90 ms still averages well under 16.7 ms, but that single frame is a visible hitch. Player movement also has to be evenly spaced, so a consistent 30 FPS often feels smoother than an uneven 60. Watch the frame time graph and look for spikes above your budget.
Should I monitor performance in a benchmark or during normal gameplay?
Use both, for different jobs. A built-in benchmark gives you comparable numbers for settings and drivers, which is ideal after an update. Normal gameplay shows the problems you actually notice, including stutter tied to a specific area or an enemy spawn. Test the same repeatable scene in normal play before you decide a setting is fixed.
How do I check FPS on a PlayStation or Xbox?
Most console games have a performance display tucked into the graphics, video or accessibility options, often labelled something like performance metrics or performance overlay. It is usually hidden from players by default. Where it does not exist, the console simply does not expose the numbers, and third-party overlay apps generally cannot read them on retail hardware.
Conclusion
Start with Win+G and the Performance widget. It takes ten seconds, needs nothing installed, and confirms your machine is producing the frames you expect. Once you want more than one number, install MSI Afterburner with RTSS, tick frame time next to framerate, and run the same three-minute scene twice before you change a single setting.